
Technology
The Essential Guide to Using Visuals in Legal Writing
Learn how to make your legal writing stand out by leveraging visuals like timelines, charts, graphs, flowcharts, and more.
-
Joe Regalia

Table of Contents
-
Should you use visuals?
-
Timelines
-
Tables
-
Textual call-outs
-
Charts and graphs
-
Maps
-
Images and recreations
-
Org charts & cast of characters
-
Visual lists
-
Flow charts
-
Five final tips to make visuals work
I've been hanging around with two (quite) different but excellent crowds: Judges and legal-tech folks. Of course, I talk about legal writing with both (because what else can I talk about?). And a fascinating question keeps popping up:
Why don't lawyers use more visuals in their legal writing?
We all know that people love consuming information graphically. Studies show that the average person today spends about half of their waking hours looking at some sort of media. So why haven't lawyers caught up?
Many judges want more visuals. The judges I talked to, say they would love to see lawyers submit graphs, tables, and other handy visuals that break down the facts or arguments in the brief. One judge said: “For Pete's sake, give me tables if there's data!”
When lawyers smartly use visuals, judges say, it helps them understand the points in a way that writing can't. Judge Posner is outspoken on this, repeatedly calling out judges and lawyers alike for ignoring the communicative power of visuals.
Creating visuals is easier than ever with new tools. Back in the day, perhaps lawyers could justify avoiding this topic because making graphics was expensive and cumbersome. Who is going to spend six hours creating a chart for a motion that took four hours to write?
But there is no excuse anymore. Because making spiffy flow charts, infographics, timelines, tables, and even simulated pictures is now as easy as a few clicks. Tons of tools have flooded the market—with many aimed straight at lawyers.
Should You Use Visuals?
But there is no excuse anymore. Because making spiffy flow charts, infographics, timelines, tables, and even simulated pictures is now as easy as a few clicks. Tons of tools have flooded the market—with many aimed straight at lawyers.
Many folks suggest that visuals can be used for four goals in legal writing: to organize, to interpret, to highlight, and to quantify.
Organize
Use a table or chart to explain how different pieces of information (say, companies or cases) fit together.
Interpret
Use a table or chart to explain how different pieces of information (say, companies or cases) fit together.
Highlight
Use a graphic to represent written information, but it in a way that's more memorable or digestible.
Quantify
Use a visual to display abstract information or data that readers would otherwise struggle to grasp.
To make it even easier to jump on the visuals train, this guide will explore visuals that you might consider in your next brief or motion.
Timelines
Nearly every case has a litany of important events, and the chronology is often muddled. Timelines give your reader a unique view of how developments unfolded—a view that, in some detailed cases, may be impossible to do well in prose.
Tables
Consider using a table whenever you have information to compare or contrast, side by side. Examples include juxtaposing evidence, juxtaposing allegations, juxtaposing cases, juxtaposing arguments—or any other information that you can compare for effect. Tables are also great for presenting large amounts of data and sorting it into categories.
Visualize Contradictions in Testimony
This example comes from a lawyer who used a table right in his brief to show the contradictions between what the plaintiff alleged in his complaint and what he said in a declaration:
| The Complaint | Witness's Declaration |
| Dr. Neal Schultz. Crushed walnut shell powder in St. Ives Apricot Scrubs are too abrasive for the face's skin. (Compl. ¶ 6 n.2) | He does "not routinely warn" consumers against using St. Ives and similar products containing crushed walnut shell. (Choi Decl., Ex. K (Declaration of Neal B. Schultz, M.D.) ¶ 2.) |
Visualize Imbalances
Tables can be effective at demonstrating imbalances. Here's a modified example that uses a table to show an imbalance between policy interests (credit to professors Steve Johansen and Ruth Anne Robbins and their fabulous article):
DRIVER'S LICENSE
SUSPENSION HEARING
SUSPENSION HEARING
-
Suspension or loss of driver's license.
-
Fines.
CIVIL RESTRAINING
ORDER HEARING
ORDER HEARING
-
Order of restraint from contacting victim in any way.
-
Limitation or suspension of parenting time.
-
Fingerprinting and registry in statewide batterer database.
-
Mandated batterer counseling.
-
Restraint from specified place where victim might live or work.
-
Payment of mortgage or rent even if not living in home.
-
Loss of personal property including animals or pets.
-
Police supervised removal of belongings from home.
-
Prohibition on purchase or use of firearms.
-
Mandated psychiatric or drug testing evaluations
Textual Call-Outs
Textual call-outs are powerful emphasis tools that will force your reader to remember something. Simply create a snippet of the most powerful phrases or sentences in your document, and set it off on the page. You can also use them instead of bullets. (Example based on original from Professors Johansen and Robbins.)
DUTY OF LOYALTY
A general partner cannot:
-
Engage in self-dealing.
-
Usurp partner opportunities.
-
Compete with partnership.
DUTY OF CARE
A general partner must act:
-
On an informed basis.
-
In good faith.
-
In best interest of partnership
Charts and Graphs
Charts and graphs are useful whenever you have data or information to compare, contrast, or plot out over time or space.
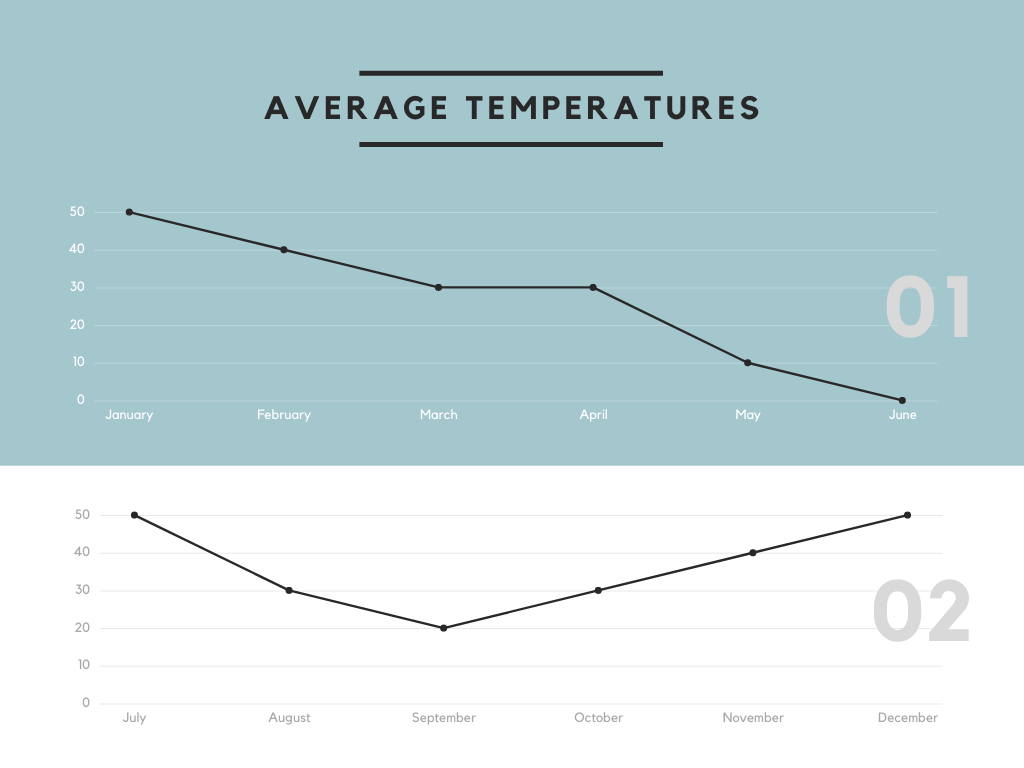
Line Graphs
Line graphs are useful for displaying how information or data changes over time. In this case, average temperatures over a one-year period.
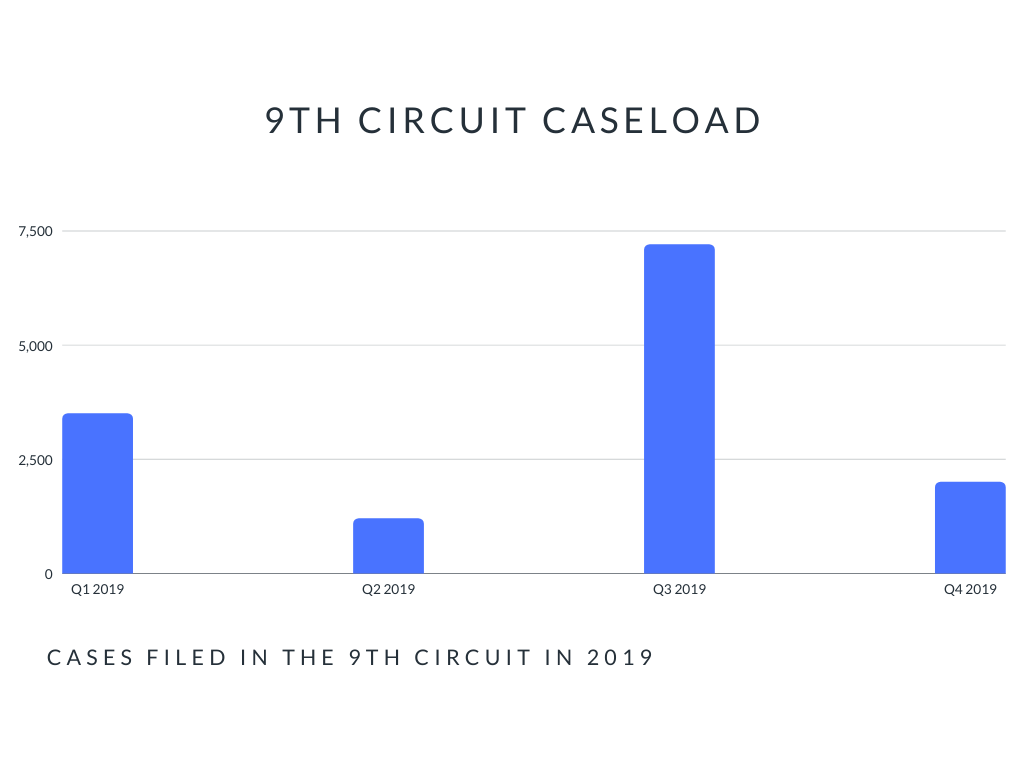
Bar Charts
A bar chart shows the frequency of each data category.
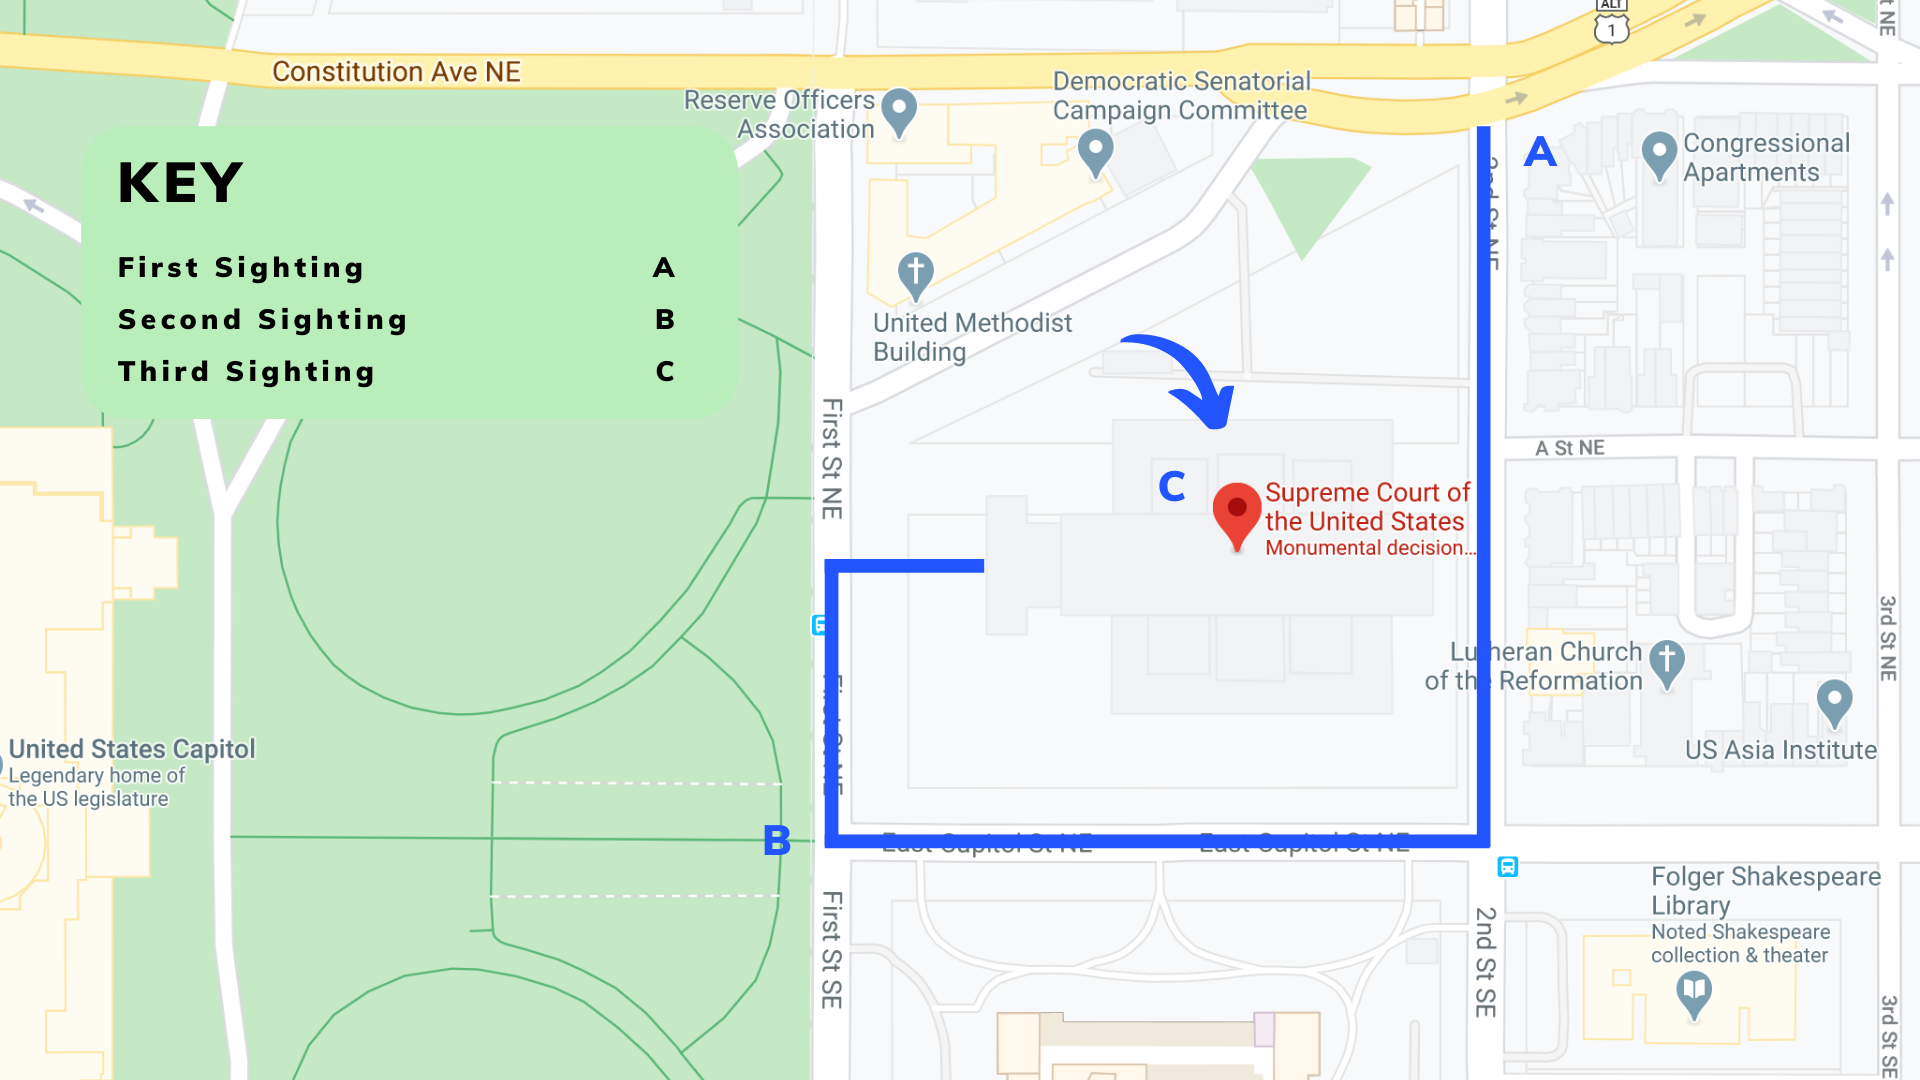
Maps
Maps are great for making any sort of spatial or location points. You can annotate a map to show where a company’s offices are or where important events unfolded.
Images and Recreations
There are many reasons why you might want to include an image in your brief.
Trademark Disputes
Good IP attorneys, for example, often use pictures to make points about how products or logos compare. Take this example from a trademark dispute between Apple and another company.

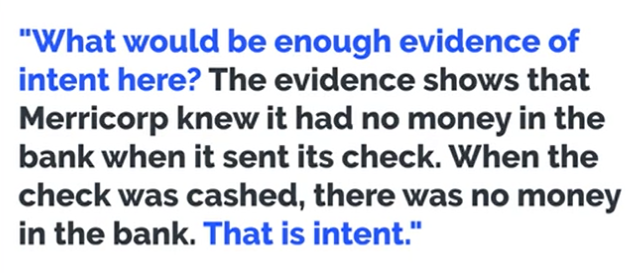
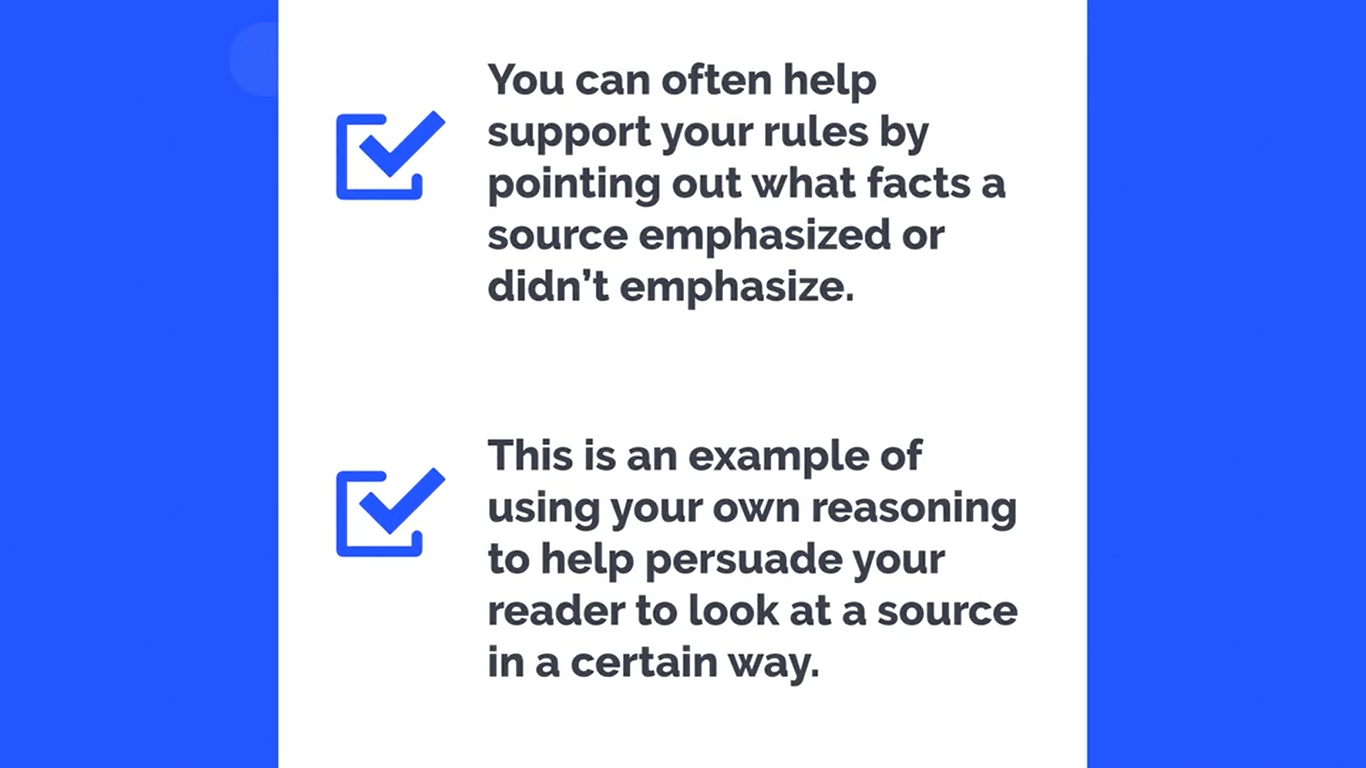
Emphasizing Key Points
Consider the below image and how an attorney might use it to emphasize their point:
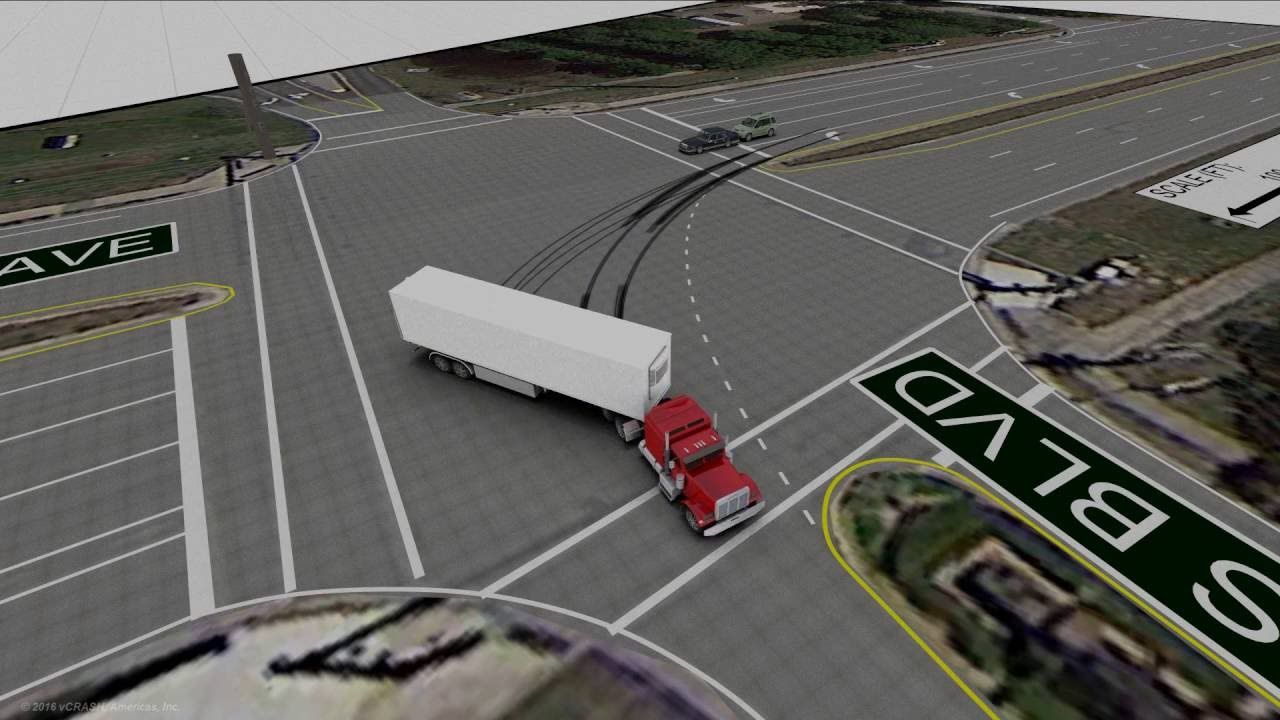
Reconstruct and Visualize Key Events
You can also use images to reconstruct important events, like this truck accident reconstruction below.
Org Charts and Cast of Characters
If your case has a lot of people or you need to explain the relationships between different key players, then a cast of characters or org chart can do wonders.
Organizational Charts
This pretty fancy org chart shows the relationship between the COO and other employees. It could really help a judge or decision-maker understand a company's organizational structure.

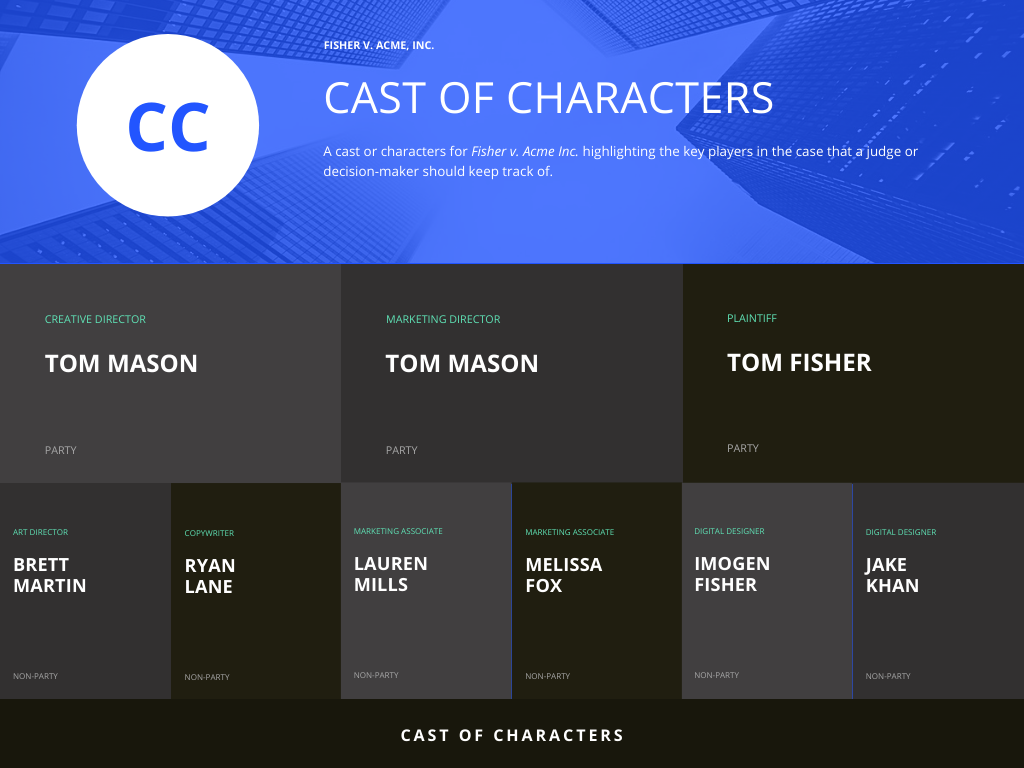
Cast of Characters
If you have a complex case with many key players, it can be confusing for a new reader to keep track of who is who. Try a cast of characters to help your reader out.
Visual Lists
If you have a list of points, reasons, or related facts, consider using bullets or icons to summarize them. These are powerful emphasizing tools, making it easy for your reader to take stock of the size of the list.
Bullet Points
Bullets are perhaps the simplest visual you can add to your legal documents. Judge Diane Wood uses this device in one of her opinions, using bullets to make her readers notice the many reasons supporting her argument:
Columns
Columns can be a great way to visually break up information—when done sparingly. It's most useful for summarizing more complex information that you plan to explain in more detail later.
Element 1
Intent
The defendant intends to cause contact with the victim.
Element 2
Contact
The defendant actually makes contact with the victim.
Element 3
Harmful or Offensive
The defendant's contact is harmful or offensive to the victim.
Flow Charts
Flowcharts are amazing at showing how processes work. Use them to show steps or any other procedure being carried out. For example, say your case hinges on your client's customer service process or workflow. Displaying that visually can help make the process crystal clear.

Five Final Tips to Make Visuals Work
Here are some additional thoughts on how to make sure you're getting the most out of visuals in your legal writing.
01. Explain Upfront
Always explain the visual beforehand (like a block quote). And do so thoughtfully. Let your reader skip the visual if they like. You should never force your reader to use a visual, lest they resent you for it.
02. Move It to the Back
Consider whether it will be less risky, and easier, to include a visual as an attachment or appendix rather than inserting it into your brief. Usually, if it’s important, it can be inserted into your brief and formatted smoothly.
03. Color Does Matter
Use colors when you can—especially to show contrasts, similarities, and groupings. But don't choose randomly. You can find plenty of great guides and resources online these days.
04. Label
Label everything thoughtfully and concisely. Use legends that are as simple and stylistic as your prose.
05. Keep It Simple
Keep it simple: Complex visuals can become harder to decipher than writing. If you are getting to that point, cut it. Otherwise your visual will become a distraction.
Joe Regalia
Write.law co-founder Joe Regalia combines his experience as both practitioner and professor to create exciting new ways to teach legal skills. Learn more about Joe
Sign up for our newsletter!
Get writing and other legal practice tips delivered to your inbox every other Thursday.
Thanks for joining!
We’ve sent a welcome email to your inbox.
We’ve sent a welcome email to your inbox.
We're on a mission to make legal skills training engaging, effective, easy to use—and accessible to all.